


modeling and measurement
I’ve been thinking a lot about behavioral modeling, particularly as it relates to validation of non concurrent prediction. In psychological reorganization (beh change), within-person variability is likely to increase, particularly when constraints are loosening (eg social or environment expectations and personal rules/strategies) and alternative (competing?) response strategies are active, dynamic and conditional indicators emerges. As systems change, other change occurs and thus change produces change and variability is a probable, bayes indicator of risk (eg HRV).
Change is increasingly likely when paired with a goal directed response strategies with more task demand, greater incentives, and cognitive factors (load, insight, etc) offering a strategically constrained process of change. These features permit interpretation of personality and validity processes as dynamic systems rather than fixed trait expressions. work on personality functioning and variability highlight one element of this pattern to me, though focused on trait theory tied to PD which, while a core element, likely forgos other transdiagnostic constructs and processes. I suspect that repeated measure approaches, for this reason, offer better predictive modeling, following basic QFT model patterns and building on more stable forces (eg trait) as predictive behavior modeling. It reminds me of an implication of Chris Hopwoods work (see below link) and AMPD more broadly
https://www.tandfonline.com/doi/full/10.1080/00223891.2024.2345880
All problems are measurement problems. svt seem to function in a standard range of effects, differentiated by method of measurement (eg mean difference is .7 to 1.3, sens/spec via Larabee limit, etc). These effects are likely part of the stable field functional analysis. Im increasingly confident in the vitality of the SD and standard effect ranges in understanding individual prediction, rather than group focused models which dominate Psychology and assessment moreover.
Disruption proceeds change.
Art Trail

Over the last year, I’ve been working with HDFS Faculty Dr. Jackson in collaboration with The Louise Hopkins Underwood Center for the Arts (LHUCA) to strengthen Lubbock’s First Friday Art Trail. This project started during my time in the provost’s office working on outreach and engagement, with my primary role being to generate societal impact survey data. Over the past year we’ve been piloting a variety of questions and building relationships around the community (TTU and otherwise). This fall marks the first (soft launch) data collection for the 2025-2026 year. The survey’s data is being analyzed to generate tourism data used to justify city funding (e.g., where people are visiting from, where they stay while visiting via hotel tax) and generate community-driven directions for growth. One area that I’m excited to begin working on this fall is the creation of an App for the FFAT so that visitors (new and repeat alike) have an guide at their finger tips, with searchable vendors, event timelines, and more. The team (which includes vendors) is so excited.
Research Update
I wanted to provide an update on several exciting projects. There are a ton of excellent ongoing projects that will be included in future updates, but here is a summary of some recent papers.
Recently Published
- Keegan has done some great work expanding contextual interpretation of the MMPI-2-RF in the VA. He took a look at the influence of service era in a neuropsychological clinic on the MMPI-2-RF, the first such examination outside of a PTSD clinic (in press). Consistent with past research he found less pronounced differences between combat era veterans (e.g., Vietnam/Gulf) compared to non-combat era Veterans (see also Ingram et al). In another paper, he took a took a look at the influence of undergoing a C&P evaluation on scale scores. Both are in press at Psychological Services.
- Tristan’s meta-analysis of the PAI is out in Journal of Psychopathology and Behavioral Assessment (Great work also Keegan!), available here. It establishes an updated level of expectation for validity scales on the PAI, typically falling between the .7 to 1.3 range with typical moderators (e.g., setting, simulation, etc.). His first, first author.
- My work with Robert Shura, Pat Armistead-Jehle, and Ryan Schroeder on the nation wide assessment project is ongoing. The PAI National Sample focused on validity scales is out now in Psychological Assessment, available here. This resource should help clinicians incorporate base rates into validity decisions for SVT, a critical consideration particularly given limitations in SVT function.
In order to provide more regular future updates, Tina is going to be helping me! 🙂
Symptom Validity: Some observations and Comments about Over-Reporting
In my view, many of the most important and most interesting questions we have about symptom validity remains either unanswered, or rarely explored. The purpose of this paper is to outline some patterns I have observed, and to describe what I believe are critical steps for the future of the field – and for the development of the scientific practice of validity interpretation more specifically.
- Feigning detection typically within a standardized band of effect, regardless of instrument used, condition, and even study type in most cases. These effects differ according to the specific statistical analysis.
a. Mean effect differences typically range between .70 and 1.30, with a standard deviation approximately half of the mean effect
b. Sensitivity ranges from .10 to .50 with an average of .30, with specificity set to .90. This standardized effect range has been termed the Larabee limit” by some.
c. Correlations between SVTs are high, often falling within a large effect range. These between domain correlations appear robust, and do not appear to differ much between distinct symptom domains of over-reporting (e.g., somatic, cognitive, and psychopathology)
i. These associations will typically be between r = .75 and .85
ii. Differences are typically around a small effect (r~|.10|) - Moderation patterns are generally typical across instruments, and have not changed as a function of the development of new instrument versions (e.g., transition from the MMPI-2 to the MMPI-2-RF, or MMPI-2-RF to MMPI-3). This pattern is consistent with assessment instrument developmental broadly [e.g., portion of cognitive test changes between WAIS/WISC versions have similarly declined in time. For instance, the purpose of an evaluation, the type of client, their diagnosis, are their racial and ethnic background are each major and common moderators of effect. Moderation tends to be a question only of meta-analysis, which tend to reaffirm these patterns such that they can be acknowledge but not explored in follow-up study.
a. Moderation patterns are rarely explored in experimental (simulation) designs, which is a missed opportunity to advance understanding of how, when, and why people respond in the manner that they do.
b. Meta-analysis evaluating criterion variables (e.g., PVT and SVT used to create criterion groups) is limited, and not possible because of how these groups are created in the literature (See Herring et al., in press – PAI Meta). - Participatory research is rare in feigning research on personality assessment, leading to a potential for over-interpretation based on assumptions. In general, it is my perspective that the study method approaches used in the development of self-report assessment often serve to reify the ideas measured based on face validity, from the perspective of the test developer. Such approaches are similarly common on substantive scales, which is why recent work has suggested the scales are not viewed in the same pathological way in a variety of groups (e.g., MMPI-3’s RC6/RC8/CMP scales).
- Most individuals who are identified as over-reporting during research studies (e.g., Known-Group Designs) score below the recommended cutoff scores for scales. Thus, positive predictive power is often low for scales, indicating that it is common for them to go undetected and highlighting some of the concerns raised by Leonhard’s thoughtful papers from 2024.
- In research, the following are not typical but seem useful to developing and advancing our theory and practice of over-reporting detection. As such, we do not have a clear consensus of what effect requirements to support more clear and concise measurement, and thoughtful discussion and debate is needed to set benchmarks for when and how to answer specific interpretive questions. Advancing methods is a key want to improve this discussion. I sometimes describe this process as one in which assessment psychologists have used face validity to reify theory, rather than taking the next step and testing assumptive processes, including:
a. SEM models to test moderation and multivariate patterns.
b. Additional group analysis inclusive of each PVT/SVT criterion, providing fruit for long term Meta-analytic interpretation.
c. Correlations Matrix of between scale relationship
d. Comparison of individual scale effects and determination of incremental utility
e. Consideration of elevation patterns following configural approaches (e.g., awareness of their multivariate nature as a lens through which meaningful interpretation is possible).
Updates (some of the many)
So many things, so so many things (hopefully I didn’t miss too many big things)
Our paper on the MMPI-2-RF/3 Scale of Scales (SOS) development is out in JCEN (in press now, as of today), producing a scale that uses a symptom severity approach via the RC scales for broad and effective over-reporting detection. The scale adds to existing scales and performs well in both simulation (Morris et al., 2021 data) and clinical (Ingram et al., 2019 Active Duty) datasets. Great work Tina, Cole, and Megan. A PDF of the paper is linked HERE.
- A paper evaluating telehealth equality to F2F assessment using the MMPI-2-RF/3 was also published in JCEN’s special issue on validity testing development. This study used a sample of Veterans (via Robert Shura collaboration) undergoing ADHD evals. Results suggest equivalence of scale performance, consistent with prior simulation studies (Agarwal et al., 2023). Great work Ali! PDF of the paper HERE!
- The SUI scale is a leading measure of risk within the MMPI, and it was expanded and revised during the MMPI-3 release. In the first study to examine the SUI scale’s longitudinal associations with suicidality, Cole published a paper in the Journal of Clinical Psychology (JCP) examining its predictive (6-week, 4 data points) utility. A PDF of the paper (proof, pre-release and not official) is HERE! Chloe, a former undergrad, is also on the paper! Nice work Cole and Megan.
- Megan recently had a paper accepted into the Journal of Personality Assessment which evaluated the utility and interpretation of the ARX scale of the MMPI-3, given its revisions. The study uses two samples (PCL-5 and CAPS) for separate screening and diagnostic interview criterion. Results suggest (1) PCL and CAPS outcomes are highly related, consistent with past work, (2) cut scores for ARX are likely to aide in screening for potential traumatic events, (3) some domains of PTSD are more associated with ARX elevations, which may require additional administered scales to fully capture pathology related to trauma. Great work Megan, Cole, and Tina. Tina lead the CAPS sample study, which was their McNairs Thesis!!! Get the PDF HERE
- Luke won another poster competition (no fun picture, I’m sure he’s sad)- this time at the first annual Division 12 (Clinical Psychology) Midwinter conference. His work is looking at PTSD assessment in AD personnel via the MMPI-2 and MMPI-2-RF, expanding on what was presented at the Combat PTSD conference (look at his award picture!) and related to his 2024 SPA poster on the MMPI-2-RF scores. Although Pk added incrementally to AXY in the prediction of clinician diagnoses, with appropriate cut scores neither scale outperformed the other in terms of diagnostic decision making and clinical utility. These results support recent work establishing how the ARX/AXY scale can be used as a diagnostic aide (Keen et al., 2023), but it is critical to recall that scale elevations alone are not diagnostic.
- Student athlete work is ongoing with the MMPI-3, and two papers presented at the 2023 SPA conference are in works. The first evaluates the CMP scale using a mixed method approach, with qualitative coding suggesting poor utility and high elevation rates in athletes unrelated to pathology. The second provides a comparison sample with therapy engagement prediction, suggesting that select internalizing are some of the best predicts. Kacey from Kent State is helping lead the writeup on some of these, along with Sarah, Megan, and others. This work ties in with Pearson’s recent addition of student athlete comparison groups for the MMPI-3.
- There are also the TONS of upcoming SPA talks and posters, including a new meta-analysis of the PAI (Tristan), applications of IRT to Likert scale items on OR scales with the PAI (Keegan), under-reporting in Veterans (Keen), trends in training on assessment within the VA (Ali), over-reporting detection with pro-rated MMPI-3 scores (Me, Pat, Yossi, and Bill), and more. Megan also is presenting some over-reporting study information for the MMPI-A-RF, with one of our AMAZING undergrads first authoring a paper. A collab with Dr. B and her student Efrain is also looking at over-reporting on the MMPI-2-RF (Morris data, which was administered via the MMPI-2-RF-EX). I’ll give updates on all of those studies after the conference with materials.
Contextual Considerations: Service Era
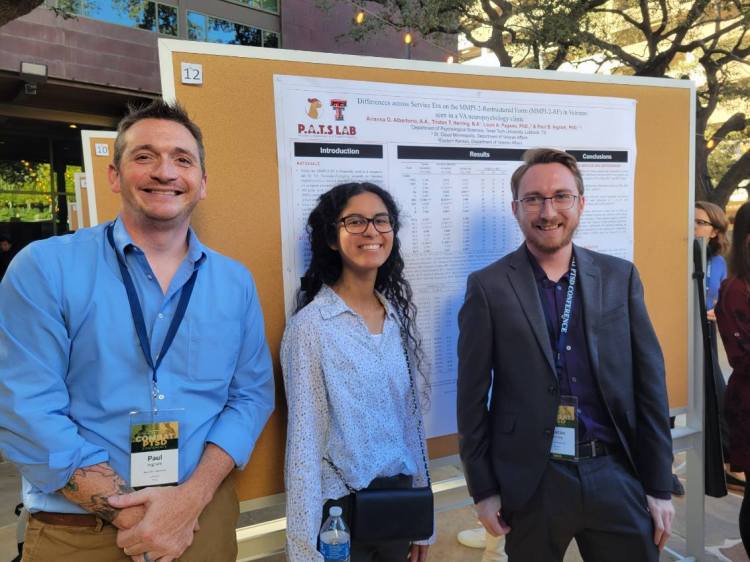
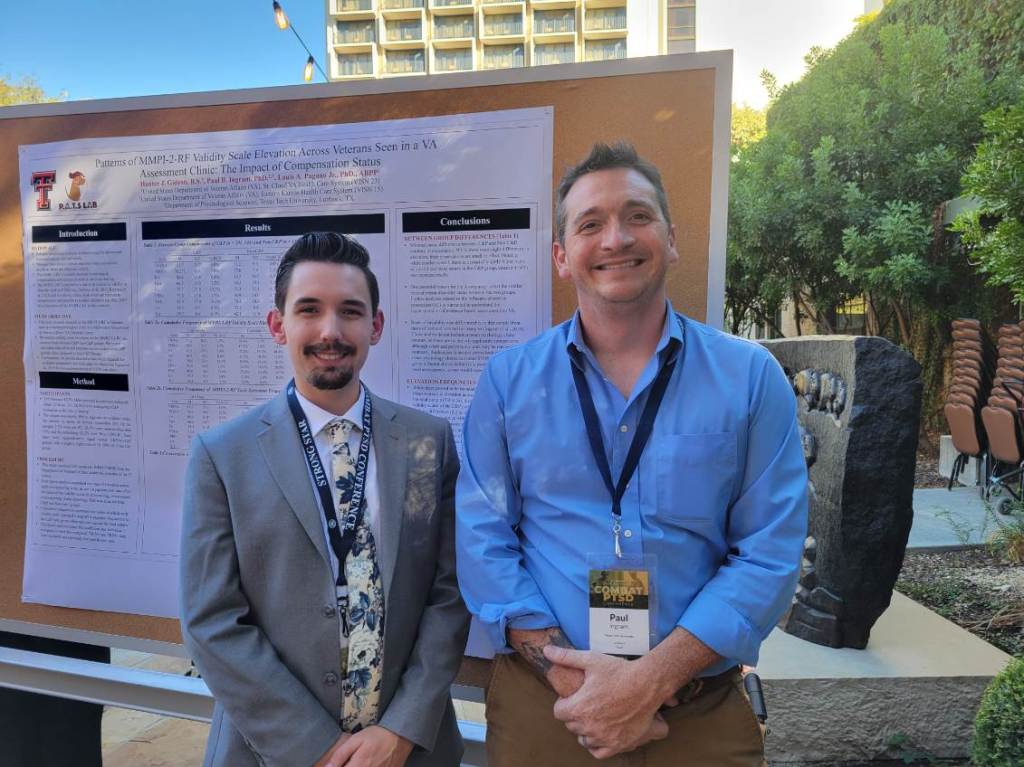
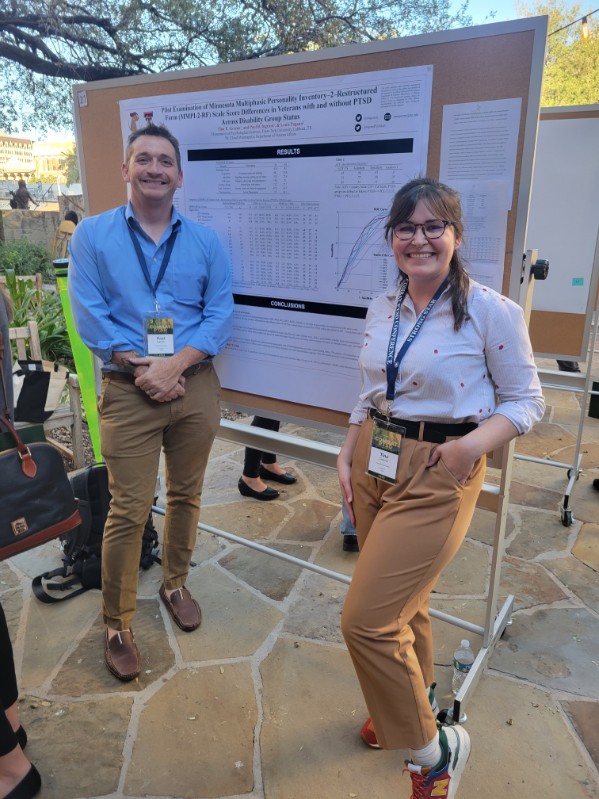
Here is the first of the dives into posters presented this year at the Combat PTSD conference. Great work by Tristan and Ari on this one!
There is a history of research looking at the influence of Service Era on broadband personality assessment inventory instruments (Glenn et al., 2022 [MMPI-2]; Ingram et al., 2020a[MMPI-2-RF]; Ingram et al., 2021 [PAI]). All of this work has been conducted in a PTSD Clinical Team (PCT) and has found that, except for the MMPI-2-RF, there is notable influence by service era that warrants unique clinical interpretations – even after controlling for things like combat exposure and gender. This new research presented at the 2023 Combat PTSD Conference in San Antonio expands the existing literature in a few ways:
- It offers the first examination of Service Era outside of PCTs, providing a test of generalizability of the MMPI-2-RF’s lack of influence by service Era.
- It provides the first evaluation of service era influence after controlling for service connection status.
- It helps contextualize a new VA clinic sample that has not yet been evaluated as part of nation-wide datapulls (see Ingram et al., 2019; 2020a, b; 2022 – each year links to a different paper from that research project)
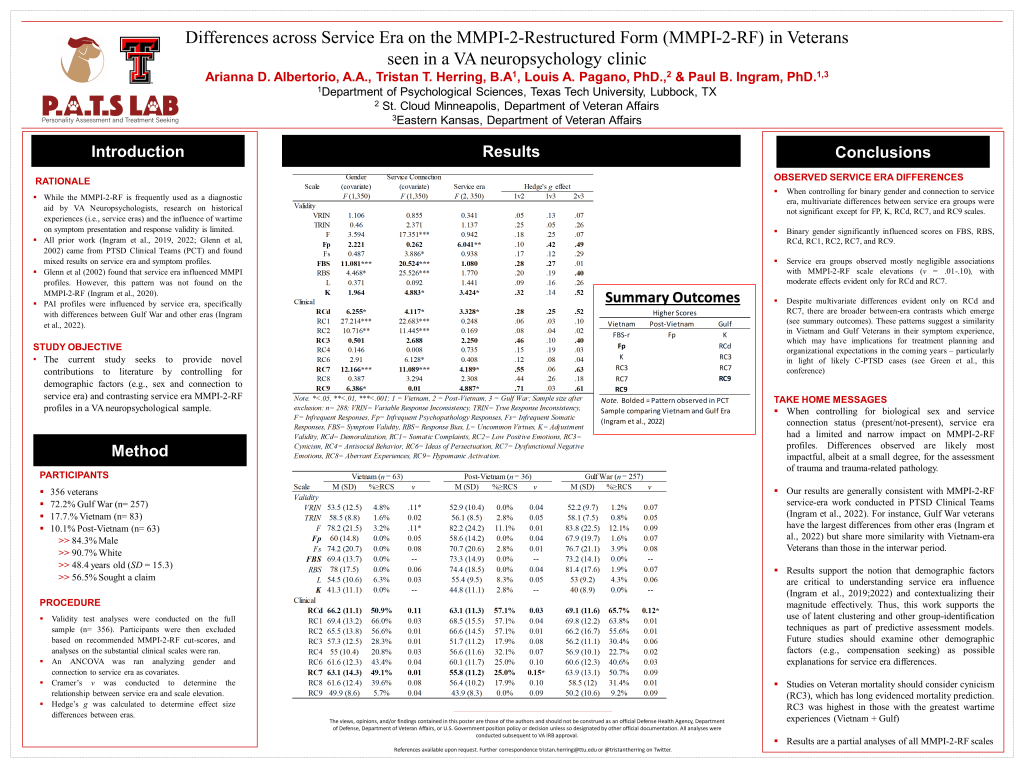
The results are great news. Prior service era findings for the MMPI-2-RF (i.e., that it didn’t influence scale scores beyond other demographic data) were supported. It looks like good news for less biased assessment methods for the VA when using the RF. One thing that is important to note is that the significance of the covariates seems to follow a general pattern of endorsement consistent with internalizing pathology mainly. As we continue this work and evaluate the remaining substantive scales it will be interesting to see if those patterns emerge consistent with trauma-pathology – a notable possibility in my view of the literature of VA assessment trends.
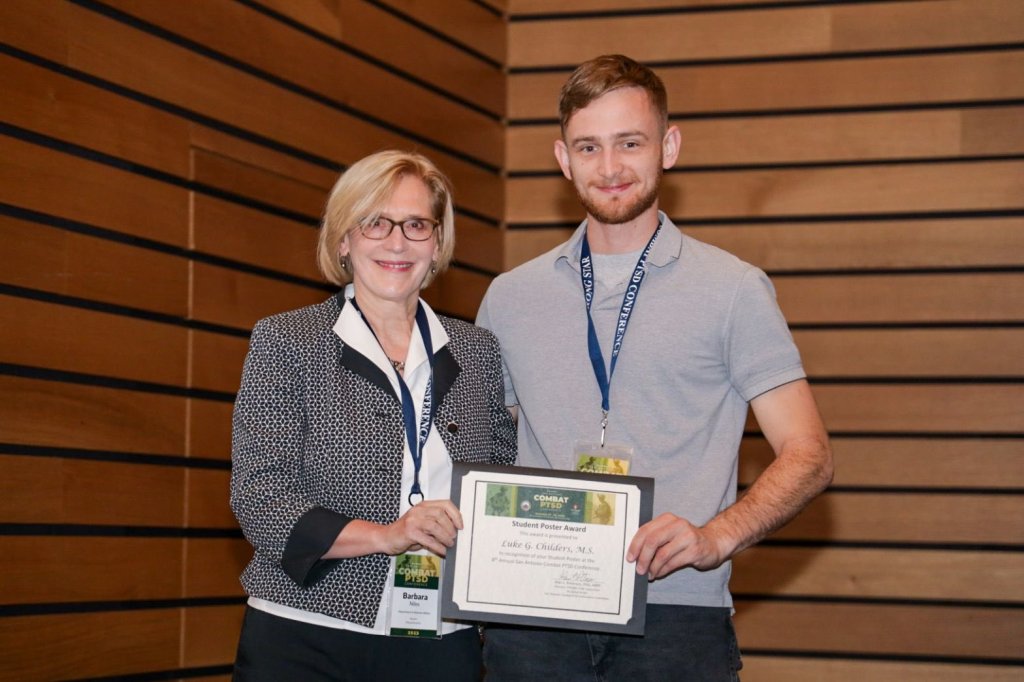
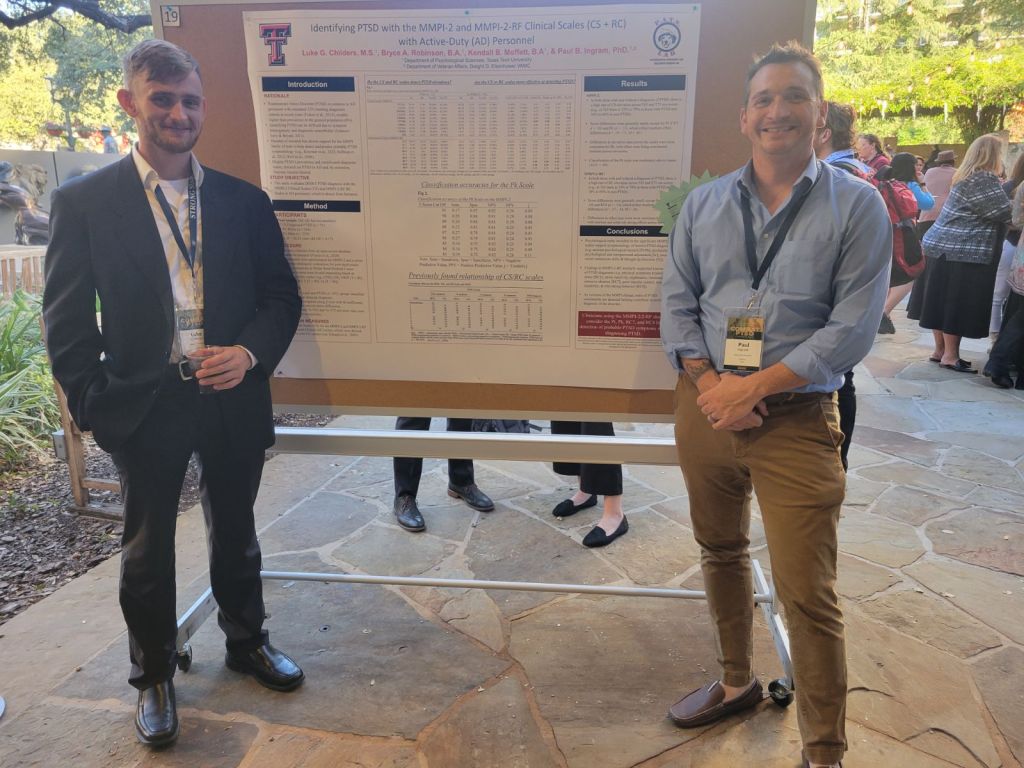
Next time I have a few I’ll write about PTSD screening with the MMPI-2 Clinical Scales and Restructured Scales (Luke’s Poster, student poster award winner!)
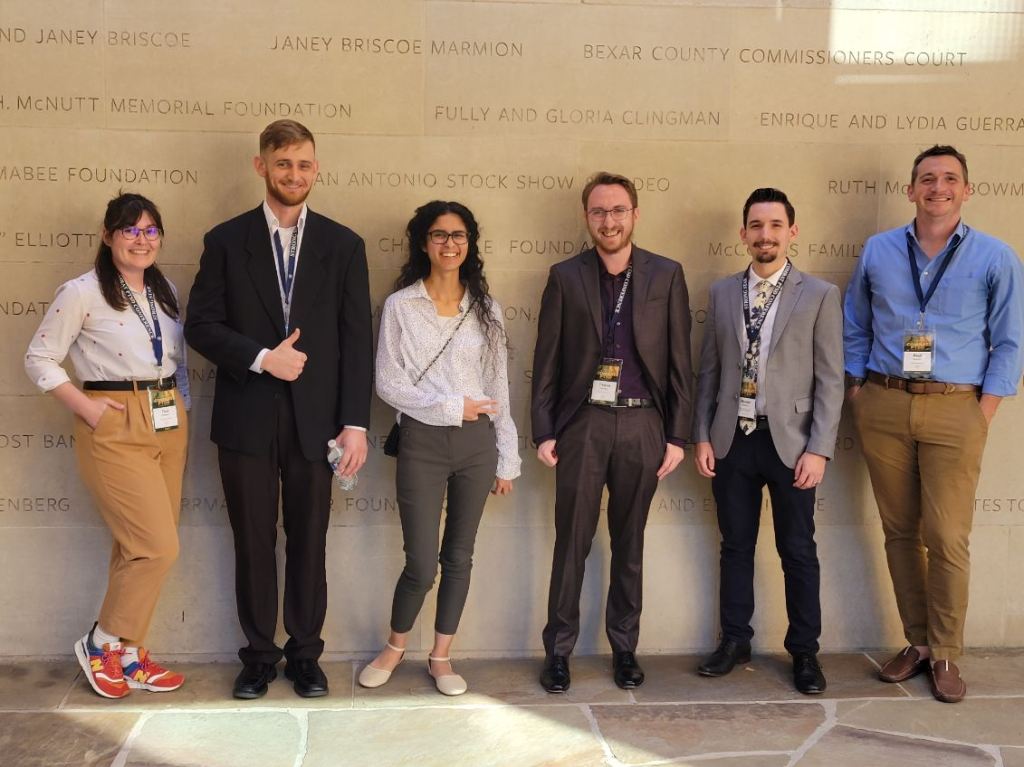
Back from the 2023 Combat PTSD Conference
Man, we had a blast. First off, Congrats to Luke Childers for winning a student poster award for his research looking at PTSD diagnosis in Active-Duty Personnel Using the MMPI-2. Killed it. Also, everyone did some awesome research – we had stuff looking at PTSD screening in two separate samples (AD and Veteran), we had a paper looking at the MMPI-2-RF validity scale patterns of elevation in a compensation seeking sample undergoing neuropsychological evaluation, and finally, a look at service era’s influence on test performance on the MMPI-2-RF in VA disability evaluations. I’ll write about each of these studies separately in short order, but til then – have some pictures of the fun!


Sarah’s First Pub with Me!
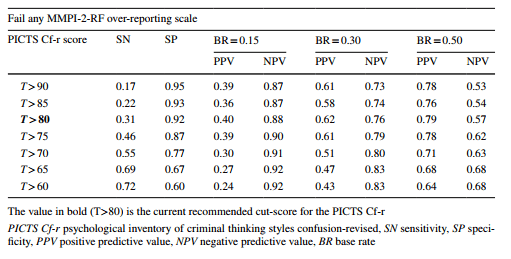
I started working with Sarah as an undergrad in Bob Morgan’s lab at Tech, collecting assessment data from local CJ sites that included the MMPI-2-RF, PICTS, and a few other measures. The PICTS is a measure of criminogenic risk, so it offered a really cool opportunity to look at the MMPI and its relationship to criminogenic risk scores on another validated measure. We started with the validity scales. So, in this study, we examined the PICTS validity scales relative to the MMPI-2-RF as a criterion. There hasn’t been much done with the PICTS in terms of evaluating the effectiveness of its validity scales, aside from the technical manual and a handful of other papers (some of which are conceptual pieces).

The results are pretty clear. We generally see acceptable classification rates and standard effect sizes expected for over-reporting scales (~.70 to 1.30). At the T80 cut-score, the best set of classification estimates (.92spec, .31sens, and the best PPV and NPV across different feigning base rates), which supports use of that score – consistent with the PICTS manual. A simple, straight forward study. Great work, Sarah.

Validity Directions
I’ve been spending more time focused on trying to figure out what problems neeed to be solved with validity. If we don’t know the problems, we aren’t going to work towards the solution and may not even recognize it.
To the best of my sense right now, there are 3 fundamental problems in validity detection efforts.
First, we have no agreed upon effect metric interpretation. To determine when a theorized domain of over reporting is more or less associated with a given scale, we seem to mostly eyeball it. For instance, the RBS scale is theoretically more associated with cognitive complaints than psychological complaints. When we compare Cohen’s D or hedges G effect sizes between RBS and F/Fp/etc, however, there are no strict guidelines when that effect is a sufficiently different to the degree required to support that hypothesis. It could be some Fischer transformation, but then I’m not sure if we should expect medium effect differences in all fairness, so what is reasonable?
Second, we do not understand the mechanisms of variation, which explain why some experimentally designed feigning studies produce vastly different results than other experimental failure groups (e.g., Morris et al., 2021; Whitman et al., 2020). This problem in variation suggests that we do not understand enough about the motivational and violence factors underlying performance, even if the effects do not generalize. In experimental conditions, which supports are difficulty in making complicated conclusions about the same sorts of Valence and motivational factors, which are present in different ways within clinical samples, where experimental studies should generalize. Thus, the whole validity = square root of reliability issue underlies, at least potentially, some validity issues in ecologically valid samples.
Third, we have yet to innovate all possible iterations of validity detection strategies, or to integrate them together, even amongst those that we already know exist (see Rogers’ work and description of various techniques). Lots of growth in this area over the last 10 years or so, but there is a lot yet to be considered. Studies are overly simplistic and haven’t evolved in design sophistication, which is likely a partial problem.
If we do not understand why, and have not assessed how very well, when it comes to the issue of “why do scores on validity scales change”. We remain in the infancy of validity detection. We must solve first factor elevation issues, prove (if applicable) our theory of response styles, and deal with the cyclical relationship between stress and invalidity.

This recent article by Obolsky et al highlights my concerns. When you look at their patterns of effect in SVT and PVT groups, we see again the problem that SVT are not distinct in their prediction of outcome (see also, Shura et al., 2023).

Until we refine what we are predicting (our criterion) and are able to do so, it’s unclear to me how well we can lean on or support existing theory of validity based on existing data. The trends are right – in general it looks pretty good – but even when just looking at PVT v SVT (not even getting into the other issues in specific reference to a given measure) we dont have the refined measurement we need to ‘best’ predictive capacity. Said another way, using another example, some of these scales (NIM, F, CBS, RBS, etc.) measure over-reporting by how we describe them, but its their NPP and specificity which are highest. As a function of what they measure, we are measuring engaged responding but not necessarily who is over-reporting (we don’t tend to catch them; Ingram & Ternes, 2016; Sharf et al., 2017).
Oh Psychology
I like to reflect on all the old classic “summary of science” books written by the various titans of our field. Revisiting some of these earlier discourses has given some interesting insight into often overlooked, but widely known and acknowledged, facts about the field. I didn’t really edit this, and its more of a late night “All the Things Graduate School Taught Me” ramble than anything else.
Psychological Facts
Fact #1. Nothing I’m going to say will shock you, much less outrage you, even though it should.
Despite people screaming from the top of their lungs about the following facts, we continue to mosey along as if none of these things are going on around us, almost in a dissociative fugue. The names of the folks who have been screaming these facts are synonymous with graduate education (e.g., Meehl, Kuhn, etc.), and psychology even more explicitly (Lillienfield, Meehl, Lykken, and others etc.- linked a few good reads). So yeh, you’re not going to be surprised, or shocked, or even upset most likely. It’s just going to be like “Yeh, I know.”
Fact #2. Almost nothing that you think you know about psychology is true.
Simply put, we continue to repeat the same old myths and legends about psychology that are not based in factual history (except the cocaine and Freud thing, that’s true). These factually inaccurate histories are embedded in how we teach “fundamental historical studies” (e.g., studies which are hailed as classics but are, in fact, complete fraud – such as the Standford Prison study) and how we talk about major theorists. Paul Meehl, an ardent proponent of Popper’s falsifiability approach to clinical science, was a Freudian despite a lack of evidence, and he found no issue in this, seeming at first glance, incongruence. He explained it noting that a lack of evidence does not indicate our inability in the future to find evidence, as told by Grant Dahlstrom with whom he was a close personal friend (Dahlstrom, 1991). Frued, as another instance, wasn’t cold or stand offish the way analytic methods are described, rather he invited clients on extended family vacations. There was no real data supporting most of the social psychology theories (e.g., Milgram, Zimbardo, etc.). Repeating again and again across topic, anything which is not based on biological processes (don’t get excited, see below) that you learned in undergraduate is about 50% false. This isn’t even the first time you’ve heard that, and I’m not the only one who’s said something like that to you.
Fact #3. Even biological processes are not understood, and we are still discovering organs.
The recent serotonin crisis in which major studies began to reveal that the leading treatment for depression doesn’t relate to depression at all. Research Domain Criteria (RDoC), the leading paradigm for linking behavior to biology via billions of dollars in federal funding, failed to produce meaning evidence of anything. We don’t know why we have some basic organs and have recently found new organs even (you can debate if the recent addition qualifies as an organ or not, but fact remains it is by technicality). We understand some things and can account for its prediction in a clear and precise pattern, akin to the logarithmic unit associated with “decibans” of a Turing Scale (e.g., smallest dose-response ratio needed to produce a given change in weight of evidence against an outcome). The “Turing Test” used as an analogous test of AI achievement (when is a computer sentient), requires the same conceptual approach. Rather than this empirical approach, we use associative conclusions which preclude causal implications (i.e., this is why we didn’t know serotonin has nothing to do with depression despite the money, lives, time, and resources spent studying it until now).
Treatment Science
Fact #1. We know basically one thing that underlies our entire theory of susceptibility: we regress under stress.
“It can be assumed that each personality type has idiosyncratic susceptibilities to particular stressors and when the dynamic system of such a type is under stress, it will manifest features of psychopathology characteristic of that type.” – Grant Dahlstrom
Thus, all theories related to first factor problems in assessment, stress response, etc. stem from the basic principle that “Under stress, we regress based on our identity. A central first problem must be understanding (1) prediction of who regresses the most (i.e., sees the largest stress response), a question of latent class probability, and (2) the specific factors which are likely to occur in tandem with such regressions (e.g., pre, peri and post risk and resiliency factors). These factors are likely numerous in name but limited in conceptualization.
Fact #2. There is zero evidence of a single causal factor of psychotherapy change.
“I spent 13 years at NIMH really pushing on the neuroscience and genetics of mental disorders, and when I look back on that I realize that while I think I succeeded at getting lots of really cool papers published by cool scientists at fairly large costs—I think $20 billion—I don’t think we moved the needle in reducing suicide, reducing hospitalizations, improving recovery for the tens of millions of people who have mental illness.”
– Tom Insel, Director of the National Institute of Health from 2002 until 2015.
Across all psychotherapy research, we have failed to produce novel changes in effectiveness despite decades of research and billions of dollars. Most of the studies will be efficacy stuffies, using some form of a wait list control (or active control) to contrast a treatment outcome. Effectiveness studies are less common, whereas studies of fidelity remain high. There will be no differences between most treatment component studies (e.g., dismantling studies of specific components, interventions for the same disorder across different methods). The effect sizes, regardless of metric, will measure approximately .70 to 1.25 at the conclusion of treatment. In follow-ups on the same evaluation metrics (e.g., self-report or other) will produce a smaller effect size, typically .5 to .75. Our current approach to studying change has yet to produce any evidence that we can explain any part of it. To make things even worse, we don’t even know how to describe the same phenomenon to each other effectively. As an analogy, we spend more time fighting over what story to tell the baby at bedtime (e.g., treatment myth, as per Frank and Frank’s contextual model of psychotherapy would term it) than discussing how to get the baby to sleep (e.g., better treatment outcome which is the purpose of the actual ritual of a bed time story). Likewise, psychotherapy interventions, even when conducted under 100% fidelity to the ideal treatment study for a given psychotherapy treatment in a highly specific sample (e.g., CBT for Depression in Veterans with a history of traumatic brain injury), can be explained fully by any other theory without exception. I should note that most therapist identify with distinct core tenants of around 4 to 5 distinct therapies, meaning 100% fidelity is a really interesting concept anyway. But that’s an aside. The real point is that there is no causal relationship between any claims made about psychotherapy and the outcomes, despite postulation around distinct vocabulary despite their shared functional definition.
Fact #3. Our research methods with psychotherapy are sloppy at best, and irresponsible at worst.
Exclusion of known covariates (e.g., working alliance) is a major difficulty, as is the limited outcome criteria, their widely known flawed psychometrics which do not meet evidence-based standards, and attempts to assert inappropriate comparisons to control capacity within other RCT research. Most continue to use mere T-tests, not accounting for any of the complexity which exists in all forms of complex social interactions – of which therapy is one. If change is a complex phenomenon which we do not understand (see above), then we should feel pretty guilty about continuing to use what we know are limited methods at great cost to the public and our clients, assuming equal effort elsewhere might produce some evidence of actual, empirically supported (and not emotionally entrenched to) treatment factors.
Fact #4. We are wholly unable to predict the outcome a single client in psychotherapy.
We can tell you what will likely happen if there are a large number of you (see #2), but we do not know what will happen to you in treatment. We can’t predict if you will stay in, be “successful”, or anything else. We know some standard risk factors consistent with any type of matching phenomenon research (ie., “Birds of feather” in terms of style and expectation, and visual appearance produce higher engagement but equal results).
Fact #5. Therapy outcomes are the same across all therapists.
Some studies find small effect differences across years of experience (positively associated with outcomes), but consistent research finds no difference in orientation, training, degree type, or license in terms of therapy success, regardless of the definition of success (completion, change, engagement, etc.). The implication is that we have no evidence-based standards by which we can assess or improve competency as a function of training, due (likely in part) to our lack of commitment to clarity on the state of research on what is a causal mechanism for therapy is, and what it is not.
Fact #6. Change in psychotherapy is not dose responsive or standardized.
“While a large number of studies focused on the efficacy of one approach, cognitive-behavioral therapy (CBT), fewer studies have examined other widely utilized treatments including psychodynamic therapy, interpersonal psychotherapy, behavioral activation, problem-solving therapy, and emotion-focused therapy, among others. Most of these treatments have demonstrated preliminary efficacy necessitating the need for further study. In addition, while the largest body of literature is for CBT, the definition of CBT is not the same across all CBT studies. This heterogeneity limits the ability to make conclusions about the CBT model (p.53)…There is still lack of sufficient evidence on the enduring long-term effects of treatments for depression (p.54).”
– American Psychological Association’s Guidelines for the Treatment of Depression
Said another way, as approved by the American Psychological Association’s Council of Representatives, elected by its members:
“Overall, treatments for depression have a modest impact on alleviating symptoms of depression (with numbers-needed-to treat of about six to eight [meaning about six to eight need to be treated for each one that is successfully treated]). This reflects both the high rate of spontaneous recovery, placebo effects of treatment, and the modest effect of treatment (either psychotherapy or pharmacotherapy). It should also be noted that there is an important group of patients who do not recover, neither through spontaneous recovery nor treatments”
-2019 APA CLINICAL PRACTICE GUIDELINE for the Treatment of Depression Across Three Age Cohorts published by the GUIDELINE DEVELOPMENT PANEL FOR THE TREATMENT OF DEPRESSIVE DISORDERS
Yup. We can’t predict effects of treatment, some people it doesn’t work for at all, and low success rates (see number to treat), and we aren’t even sure what CBT “is”, much less the issue that the same “CBT” mechanisms can’t even be sure to be “CBT” (see earlier treatment fact #2).
Fact #7. We don’t know why any medications work.
There is no evidence that the supposed mechanisms (e.g., serotonin reuptake interruption) lead to the purported outcomes (e.g., less depressed), or that we are able to predict how an individual will respond to a given type of medication. Again, we cannot actually predict our intended goals (e.g., specific patient outcomes) any better than we could a hundred years ago.
Assessment Facts
Fact #1. We have not improved measurement of invalid responding notably in quiet some time.
Scales tend to produce the same level of effect, depending on item scaling and contextual factors related to response style (E.g., disability evaluation, etc.), regardless of their theoretical basis or construction design. These effect sizes range from approximately .75 to 1.50. We can rule out folks with high probability by setting our scales that way, but we are poor at the detection of feigned symptoms which do not fall on normal distributions (e.g., memory or chance). Some have suggested an approximate .30 sensitivity “limit” even, terming it the “Larabee Limit”. We can reach these thresholds easily, regardless of method. We can sum scales (randomly selected, or theoretically derived), based items on theory and empirical support, or use infrequent-based approaches – they all produce the same outcomes. We can reduce or lengthen the scales, they all produce around the same effects. There aren’t major differences between theoretical taxonomical groups (See Fact #2), so we just get a lot of different tests that tell us different versions of the same thing. Once we are able to get past none of the scales mattering in what they measure or how they measure it, we can face the fact we do not know any causal reasons for elevation and can, most accurately, describe the data as being interpretable or not. We can describe certain other probabilities (e.g., malingering), but we cannot conclusively prove an internal state (motivation) in another. This issue revolves around the same issue in the treatment sciences in which causal factors are not known. Moreover, even given these limitations and ignoring them entirely, our study designs to validate these scales rarely consider any of their long-established moderators (e.g., sex, gender, ethnicity, etc. etc.). We have no real evidence of why, or how, people approach feigning across these tests, and have prioritized proposing theory rather than supporting it. Our approaches remain relatively unchanged for decades, with only the smallest adaptions being infused (e.g., incorporating an empirical keying-style approach to validity scale detection, in addition to clinical scales [RBS on MMPI and CBS on PAI], using infrequent approaches on a specific population with higher pathology to adjust the base rate of infrequency [Fp, Fs, etc.]). These changes, as noted previously, have not produced sizable or notable change in effects across decades of meta-analyses.
Fact #2. Even our most advanced diagnostic models are not truly taxonomical.
Linnaean delineation of species (e.g., classifications that determine if a bat is a mammal or a fishy) does not match our current approaches because we use covariance based assumptions, rather than appropriate modeling. Such a modeling difficulty is consistent with the mismatch between “Historical Science” and “Predictive Science” (). This terminology is from Harvard circa the early 1990s to describe different science tracks, based on different approaches to discovery. Darwin, when providing evidence of evolution, wasn’t able to manipulate time, but rather approached science from a distinct approach more fitting to the research question than the controllable predictive sciences. Perhaps psychology should adapt methods fit more for the Bayesian, probability-based model building, rather than strict empirical controls (e.g., Hi-Top, RCTs). Historical science approaches using “uniformitarian assumptions” and “history inference” are successful at producing predictable outcomes, but we do not use these methods in psychology effectively. Said more clearly within modern models of treatment research, perhaps idiographic meta-analysis will provide the strongest basis of truth upon which to expand into larger predictive models (erosion and plate tectonic deductions also worked like this as their current predictive models were developed).
Anyway, back to Netflix. Wheel of time needs to hurry up.
