


Nomorbidity (aka honest responders) and Validity/Symptom Circularity
The absolutely fantastic statistical magicians Ashley Watts had a new pre-print, and Eiko Fried wrote a recent wonderful blog post to show her evidence that comorbidity within our assumed models of psychopathology may not hold up well (e.g., Internalization/Externalization models like HiTop).
https://eiko-fried.com/blog/psychopathology-structure-changes-with-severity
As someone working in validity theory, I see a direct parallel that changes how we should think about performance validity, symptom validity, and the very structure of what we’re measuring. Fried’s blog (discussing Watts et al.’s preprint) demonstrates the correlation between psychopathology domains like internalizing and externalizing is largely an artifact of mixing clinical and healthy populations. When you have a heavily zero-inflated sample where most people have no symptoms, you artificially inflate correlations between domains that may be entirely independent within each subgroup. One of the things he points to is the change in SD as a function of severity, which suggests to me a very close parallel to SVT validity patterns. Over-reporting, after all, more often produce many of the same patterns – stable effect sizes and classification patterns and difficulty isolating consistent theoretical elements (E.g., SVT-PVT correlation, as well as domain level distinctions). Moreover, I am assuming and proposing that the way people think and engage in tests reflect a pattern of unlikely high comorbidity compared to their baseline pathology they possess.
I took the basic premise of his simulation and extended it here to symptom validity. Given our poor understanding of what PVTs are, I wanted to stay focused on at least the same dimensional, individualistically measured traits that represent symptom tests. Its increasingly clear that they are distinct and can be at times, entirely separate constructs so its better to treat them that way (. Fried’s blog demonstrates that the correlation between psychopathology domains (eg internalizing and externalizing) is largely an artifact of mixing clinical and healthy populations. When most people have zero symptoms, you artificially inflate correlations between domains that may be entirely independent within each subgroup.
The simulation extends this logic to validity testing. Most SVTs approach classification from “fabrication vs. honest” models where we typically apply in tests like T-test, unidimensional AUC, or ANOVA to evaluate SVTS (a necessary clinical reality for any sort of determination-based evaluative decision). Instead, this simulator implements the more realistic case of partial malingering. Just like with non-content responding (e.g., random, inattentive, as measured by VRIN/TRIN on the MMPI), mixed responding of symptom validity is also the most common. Individuals are more likely to exaggerate or misrepresent than outright fabricate, and this can occur both intentionally and not (misremembering, emotional salience, awareness, etc.). As a result, many individuals who are misrepresenting symptom presentation are also genuinely symptomatic in some ways that may, in truth, be impairing and qualifying of services or whatever the evaluation is for. This is what dominates real compensation-seeking samples. To me, this sounds like the same issue of nomorbidity/comorbidity. In effect, nomorbidity is the honesty (but pathological) control who represents the null state of how mental health is structured in their experience with respect to frequency, intensity, duration, and scope of symptom as ipsative normal. Comorbidity becomes the distorted response pattern, exaggerating across symptoms measures and items and often theorized as symptom domain elements of somatic, cognitive and psychologically based symptoms (see AACN/NAN consensus status on symptom validity).
This explains why we struggle to find clean, replicable factor structures in validity samples. The exaggeration strategy (see Rogers & Bender, 2018) doesn’t respect the theoretical boundaries between somatic, cognitive, and psychological symptoms the way genuine pathology does. It splashes across everything, artificially inflating the apparent coherence of psychopathology and making it look like there’s a strong general factor when most of that structure is actually just the signal of people saying “yes” to too many things. This is why we don’t always see it (e.g., Gervais et al., 2007). It’s often been invalidation studies, which makes sense because we are pulling a situationally bound, context specific effect that emerged in that case. These referral and clinical context patterns are showing influence on these basic assumptions with SVT-PVT relationships.
Until I figure out how to plug this into an embedded window like he did, the simulation models showed symptom scores as an additive decomposition of genuine pathology and exaggeration: O = G + I, where O is the observed score, G is the bona fide symptom level (correlated across domains at r_G ≈ .30), and I is the invalid exaggeration component added only by non-credible responders according to base rate. The invalid component itself contains both a coherent exaggeration strategy (domains correlated at r_I) and a magnification term coupling it to genuine pathology (c). The pooled observed variance decomposes as Var(O) = Var(G) + Var(I) + 2·Cov(G,I), meaning the observed correlation between domains becomes weighted : r_O ≈ [Var(G)·r_G + Var(I)·r_I + 2·Cov(G,I)] / Var(O). When BR = 20% and exaggeration adds ~1.5–1.8 SDs, this inflates observed inter-domain correlations from r = .30 to r ≈ .70–.75, and the first eigenvalue (general factor strength) jumps from ~53% to ~75% of variance—meaning most of the apparent “general factor” in validity samples is artifact, not psychopathology. The inflated eigenvalue is the mathematical signature of a contextually activated exaggeration strategy. This is just what Eiko’s post was talking about, except in pathology.
And because partial malingerers still have real symptoms underneath, you can’t just remove them from your sample without also removing genuine pathology. Doing so changes the underlying comoribidty pattern observed across endorsements, and echoes the nomorbidity/comorbidity issue of internalizing/externalizing dimensions and the whole underlying ‘what causes problems and when do they occur’ debate.
I called the general factor scale of the MMPI the Scale of Scales validity indicator the SOS for a reason (Ingram et al., 2024). I found no matter what content we included via the RC scales, the outcome was the same. Gaines et al (2013) and Aita et al (2025) found the same thing on the PAI, and the literature is quickly growing across measures of the same pattern generally. We really need to stop and rethink what we assume is true and test it. Tristan and I recently wrote an invited commentary (in review) about some of these points, focusing on dispelling domain level distinction myths and critiquing the truly nascent research in this field. This is a flashback to one of my first research projects on validity, I called it “Validity is invalidity” and I looked at the MMPI-2 scales in a large (9k), nationally sampled VA sample. I did it poorly, but I still thinking the same thing I am now- How we measure validity isn’t fitted to what we say we are measuring. This seems like a good measurement step to resolving that problem. We have a few papers coming out looking at this exact problem in various self-report instruments.
-Rushed post, I need to double check my maths.
Freedom of Speech at TTU
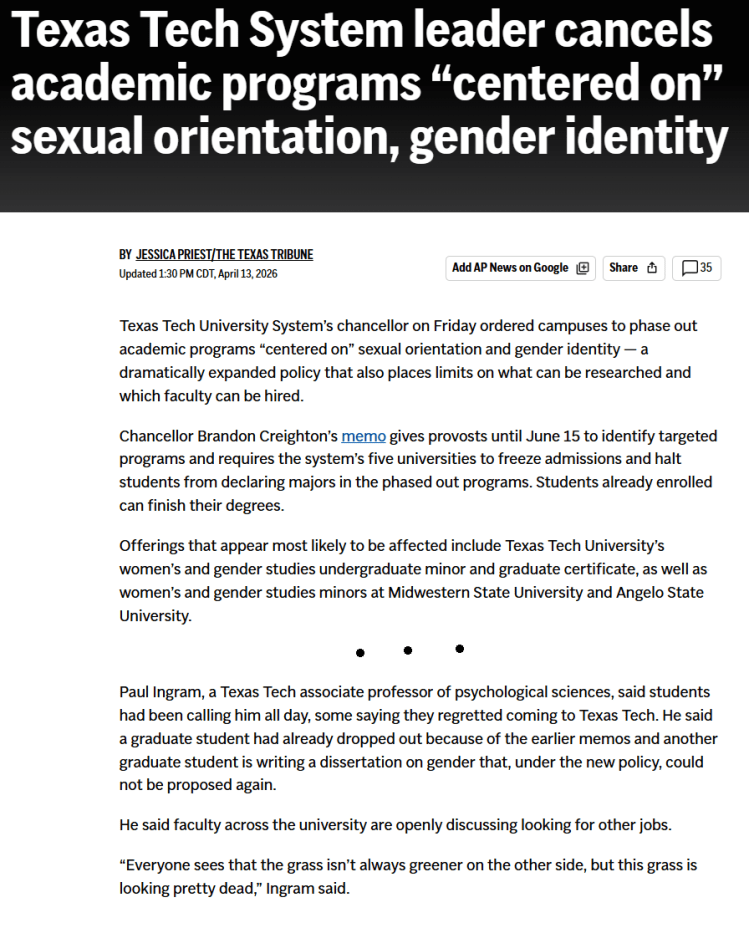
https://apnews.com/article/texas-texas-academic-programs
I hope my feelings about censorship, racism, sexism, and the destruction of my institution by politicians is clear- the impacts on my students, their education, and the clients we serve is clear (for me, its mostly veterans and military personnel, fathers, dads, and men trying to live their best lives). Lets help people, not hurt them.
Selected Publication Update
Below are some of the recent papers I’ve been on, many of them still in press at this time. I’m missing a few PDFs I’ve become aware in making this page, so I will update it. There are a number of older papers from 2025 publication that are not included here for brevity and time.
| Project | Summary |
| Herring & Ingram (in press) | In this paper, we evaluate and review how the APA ethics code intersects with Artificial Intelligence in the domain of Psychological Assessment. We discuss these gaps, offer recommendations, and hypothesize about ways in which GenAI may be used to meet emerging needs of client and clinicians from the perspective of Counseling Psychology. |
| Herring, Rogers, & Ingram (in press) | In a longitudinal (1yr) assessment-focused paper evaluating adolescent sibling dyads using the MMPI-A-RF and a host of cognitive, behavioral, and mental health data (parent, self, other). We examine ways in which multi-informant data may be harmonized to align with HiTop dimensions. |
| Shura, Rine, Ingram, Schroeder, & Armistead-Jehle (in press)) | Using a national population of Veterans assessed in MHA 2008-2024 (n~6000), we examine the MCMI validity scales and their same day relationship to the MMPI-2-RF |
| Parent & Ingram (2026) | In this study, we examine business training of health service psychologists in relation to career intention and training elements. |
| Diehl, Herring, Albertorio, Ingram, & Pagano (in press a) Diehl, Herring, Ingram, Pagano, & Gideon (in press b) | In this two paper series, we examine how (1) compensation and pension / Service Connection and (2) Service Era impact assessment profiles, building on existing work examining ways to improve assessment accuracy and reduce interpretive biases |
| Shura, Ingram, Schroeder, & Armistead-Jehle (in press) | Using a national population of Veterans assessed in MHA 2008-2024 (~30,000), we examine the Personality Assessment Inventory (PAI) validity scales and evaluate rates of performance to establish standard population base rate norms. |
| Aita…Ingram, et al. (2026) | A recent issue with the detection of invalidity of symptom profiles is that many scales function similarly. As a result, this base-rate approach to validate determinations examines its potential using a multi-population sample including Department of Defense and Department of Veteran Affairs persons. |
| Victor, Mitchell, & Ingram (in press) | In a longitudinal sample of depressed and highly suicidal college students (50% active ideation and past attempts), we examine how the depression, self-criticism, and NSSI relate to one another over the course of a few months. |
| Victor, Bianco, McClay, & Ingram (in press) | In this study, we created a new scale to measure the Public Stigma of Nonsuicidal Self-Injury (STONSI) scale. This study included two samples, including a longitudinal high risk depression sample (see Morris et al., 2023). |
Underlined names are graduate or undergraduate students.
Post-Empiricism as the Anti-Fragile Assessment Psychology
I’m going to make a longer post with a table that includes recent publications, shoutouts to student coauthors, and the theoretical implication for each of these papers – organized across domains of thought that I think are important to advancing personality science. I’ve used this blog a few times now as a way to notetake my thoughts as I go throughout the process of publications etc. In doing so, it has helped me organize my philosophy of science and come to understand better what it is in relation to the field. Largely, I find myself to identify with the term “post-empiricist” to best describe my critical, intersectional, and (at times) anti-empirical reliance on objectivity and control. I have put these thoughts together in a paper that I have submitted for publication, but I have shared with a few trusted folks already to get feedback and reactions. I thought I might share it here as well, in it’s unpublished form. I’m uploading it to a public pre-print server later today as well and will add that information below.
methods thoughts
We must move beyond traditional statistical and research-based approaches to focus on item experience—the process by which individuals attend to, interpret, abstract, and respond to the constituent elements of a test item. Each of these elements—wording, implied time frame, reference class, emotional salience, response format, and contextual assumptions—contributes to an item-level environment that shapes how the item is experienced rather than merely endorsed. It is this item-level environment, interacting with the contextualized individual, that produces the observed response. Subgroup analyses attempt to model relatively homogeneous patterns of these item experiences, with the recognition that any subgroup reflects structured regularities rather than uniformity, and that similarities and divergences exist both within and across groups. This complex experience of item experience is the abstraction process, so it seems to me (if by nothing but by another name). I do not believe we can explain this process to the point of actuarial supportial in our tests for their specific items in their current form, and this poses a substantial problem for the field and the practice of assessment. That, itself, is where bias is found (or may be) and decades of evidence suggests it’s there. I dont think we have this type of data for any test, and given the politicicalization of the judicial, extreme caution to protect minoritized communities becomes even more paramount. This gap of knowlesge is a major problem needing a complex solution fast, or not merely risk real harm but nearly guarantee more of it.
Symptom Validity
I’ll be posting an update soon with a number of papers and such from the last year, along with links to those PDFs and a brief discussion of what I found in each and how I think about it. I wanted to make a few notes about SVTs and symptom validity testing here, and how I’m seeing the literature broadly. It seems fairly clear to me that there are not reliably and incrementally useful differences in the supposed domains of over-reporting (e.g., cognitive, psychological, somatic) and that things, instead, seem to function in a more unified manner – with over-reporting as a general function.
My way of thinking about this currently is that as abstraction processes loosen, as a function of controlled executive function, mood regulation, or other cognitive process – intentionally [consciously] or not, the greater the interpretive band about item meaning becomes. As it loosens, I expect that people try to apply novel ideas to bounded language concepts – leading to poor description (such as when trying to feign psychosis, e.g., dissimulation) or other inaccuracy of type (misunderstanding normal or symptom trajectories). I think this is why we are seeing the same patterns repeat across MMPI-2/RF/3 and PAI+ over-reporting scales. Its why the same moderators appear, and why effect size ranges tend to standardize. I think scores outside of this range are likely an unrealistic example of abstraction processes – its also why they most often occur in simulation designs with students, the weakest feigning/malingering/etc design. It seems like what is happening is that there is a general bounded ceiling to which most people adhere (with, of course, deviations from bounding) – similar to how without speed limits everyone has a speed they feel ‘most comfortable with’ while driving. There are speed demons too, of course.
I was looking at some of the ratios of change between conditions/moderators across meta-analyses (Herring et al., Ingram & Ternes, Sharf et al., etc etc.) and it seems like the ratio between the domains decreases as the hedge’s g/cohen’s d of the overall effect size increase. This reinforces my belief that its a bounded system driven by this more cohesive and unified over-reporting process.
I’ll be posting some of the articles that focus on this in detail that published this last year shortly, and will have several updates about papers upcoming that tend to point to the same findings, including national VA samples with the MMPI-2-RF
modeling and measurement
I’ve been thinking a lot about behavioral modeling, particularly as it relates to validation of non concurrent prediction. In psychological reorganization (beh change), within-person variability is likely to increase, particularly when constraints are loosening (eg social or environment expectations and personal rules/strategies) and alternative (competing?) response strategies are active, dynamic and conditional indicators emerges. As systems change, other change occurs and thus change produces change and variability is a probable, bayes indicator of risk (eg HRV).
Change is increasingly likely when paired with a goal directed response strategies with more task demand, greater incentives, and cognitive factors (load, insight, etc) offering a strategically constrained process of change. These features permit interpretation of personality and validity processes as dynamic systems rather than fixed trait expressions. work on personality functioning and variability highlight one element of this pattern to me, though focused on trait theory tied to PD which, while a core element, likely forgos other transdiagnostic constructs and processes. I suspect that repeated measure approaches, for this reason, offer better predictive modeling, following basic QFT model patterns and building on more stable forces (eg trait) as predictive behavior modeling. It reminds me of an implication of Chris Hopwoods work (see below link) and AMPD more broadly
https://www.tandfonline.com/doi/full/10.1080/00223891.2024.2345880
All problems are measurement problems. svt seem to function in a standard range of effects, differentiated by method of measurement (eg mean difference is .7 to 1.3, sens/spec via Larabee limit, etc). These effects are likely part of the stable field functional analysis. Im increasingly confident in the vitality of the SD and standard effect ranges in understanding individual prediction, rather than group focused models which dominate Psychology and assessment moreover.
Disruption proceeds change.
Art Trail

Over the last year, I’ve been working with HDFS Faculty Dr. Jackson in collaboration with The Louise Hopkins Underwood Center for the Arts (LHUCA) to strengthen Lubbock’s First Friday Art Trail. This project started during my time in the provost’s office working on outreach and engagement, with my primary role being to generate societal impact survey data. Over the past year we’ve been piloting a variety of questions and building relationships around the community (TTU and otherwise). This fall marks the first (soft launch) data collection for the 2025-2026 year. The survey’s data is being analyzed to generate tourism data used to justify city funding (e.g., where people are visiting from, where they stay while visiting via hotel tax) and generate community-driven directions for growth. One area that I’m excited to begin working on this fall is the creation of an App for the FFAT so that visitors (new and repeat alike) have an guide at their finger tips, with searchable vendors, event timelines, and more. The team (which includes vendors) is so excited.
Research Update
I wanted to provide an update on several exciting projects. There are a ton of excellent ongoing projects that will be included in future updates, but here is a summary of some recent papers.
Recently Published
- Keegan has done some great work expanding contextual interpretation of the MMPI-2-RF in the VA. He took a look at the influence of service era in a neuropsychological clinic on the MMPI-2-RF, the first such examination outside of a PTSD clinic (in press). Consistent with past research he found less pronounced differences between combat era veterans (e.g., Vietnam/Gulf) compared to non-combat era Veterans (see also Ingram et al). In another paper, he took a took a look at the influence of undergoing a C&P evaluation on scale scores. Both are in press at Psychological Services.
- Tristan’s meta-analysis of the PAI is out in Journal of Psychopathology and Behavioral Assessment (Great work also Keegan!), available here. It establishes an updated level of expectation for validity scales on the PAI, typically falling between the .7 to 1.3 range with typical moderators (e.g., setting, simulation, etc.). His first, first author.
- My work with Robert Shura, Pat Armistead-Jehle, and Ryan Schroeder on the nation wide assessment project is ongoing. The PAI National Sample focused on validity scales is out now in Psychological Assessment, available here. This resource should help clinicians incorporate base rates into validity decisions for SVT, a critical consideration particularly given limitations in SVT function.
In order to provide more regular future updates, Tina is going to be helping me! 🙂
Symptom Validity: Some observations and Comments about Over-Reporting
In my view, many of the most important and most interesting questions we have about symptom validity remains either unanswered, or rarely explored. The purpose of this paper is to outline some patterns I have observed, and to describe what I believe are critical steps for the future of the field – and for the development of the scientific practice of validity interpretation more specifically.
- Feigning detection typically within a standardized band of effect, regardless of instrument used, condition, and even study type in most cases. These effects differ according to the specific statistical analysis.
a. Mean effect differences typically range between .70 and 1.30, with a standard deviation approximately half of the mean effect
b. Sensitivity ranges from .10 to .50 with an average of .30, with specificity set to .90. This standardized effect range has been termed the Larabee limit” by some.
c. Correlations between SVTs are high, often falling within a large effect range. These between domain correlations appear robust, and do not appear to differ much between distinct symptom domains of over-reporting (e.g., somatic, cognitive, and psychopathology)
i. These associations will typically be between r = .75 and .85
ii. Differences are typically around a small effect (r~|.10|) - Moderation patterns are generally typical across instruments, and have not changed as a function of the development of new instrument versions (e.g., transition from the MMPI-2 to the MMPI-2-RF, or MMPI-2-RF to MMPI-3). This pattern is consistent with assessment instrument developmental broadly [e.g., portion of cognitive test changes between WAIS/WISC versions have similarly declined in time. For instance, the purpose of an evaluation, the type of client, their diagnosis, are their racial and ethnic background are each major and common moderators of effect. Moderation tends to be a question only of meta-analysis, which tend to reaffirm these patterns such that they can be acknowledge but not explored in follow-up study.
a. Moderation patterns are rarely explored in experimental (simulation) designs, which is a missed opportunity to advance understanding of how, when, and why people respond in the manner that they do.
b. Meta-analysis evaluating criterion variables (e.g., PVT and SVT used to create criterion groups) is limited, and not possible because of how these groups are created in the literature (See Herring et al., in press – PAI Meta). - Participatory research is rare in feigning research on personality assessment, leading to a potential for over-interpretation based on assumptions. In general, it is my perspective that the study method approaches used in the development of self-report assessment often serve to reify the ideas measured based on face validity, from the perspective of the test developer. Such approaches are similarly common on substantive scales, which is why recent work has suggested the scales are not viewed in the same pathological way in a variety of groups (e.g., MMPI-3’s RC6/RC8/CMP scales).
- Most individuals who are identified as over-reporting during research studies (e.g., Known-Group Designs) score below the recommended cutoff scores for scales. Thus, positive predictive power is often low for scales, indicating that it is common for them to go undetected and highlighting some of the concerns raised by Leonhard’s thoughtful papers from 2024.
- In research, the following are not typical but seem useful to developing and advancing our theory and practice of over-reporting detection. As such, we do not have a clear consensus of what effect requirements to support more clear and concise measurement, and thoughtful discussion and debate is needed to set benchmarks for when and how to answer specific interpretive questions. Advancing methods is a key want to improve this discussion. I sometimes describe this process as one in which assessment psychologists have used face validity to reify theory, rather than taking the next step and testing assumptive processes, including:
a. SEM models to test moderation and multivariate patterns.
b. Additional group analysis inclusive of each PVT/SVT criterion, providing fruit for long term Meta-analytic interpretation.
c. Correlations Matrix of between scale relationship
d. Comparison of individual scale effects and determination of incremental utility
e. Consideration of elevation patterns following configural approaches (e.g., awareness of their multivariate nature as a lens through which meaningful interpretation is possible).
