Oh Psychology

I like to reflect on all the old classic “summary of science” books written by the various titans of our field. Revisiting some of these earlier discourses has given some interesting insight into often overlooked, but widely known and acknowledged, facts about the field. I didn’t really edit this, and its more of a late night “All the Things Graduate School Taught Me” ramble than anything else.

Psychological Facts

Fact #1. Nothing I’m going to say will shock you, much less outrage you, even though it should.

Despite people screaming from the top of their lungs about the following facts, we continue to mosey along as if none of these things are going on around us, almost in a dissociative fugue. The names of the folks who have been screaming these facts are synonymous with graduate education (e.g., Meehl, Kuhn, etc.), and psychology even more explicitly (Lillienfield, Meehl, Lykken, and others etc.- linked a few good reads). So yeh, you’re not going to be surprised, or shocked, or even upset most likely. It’s just going to be like “Yeh,  I know.

Fact #2. Almost nothing that you think you know about psychology is true.

Simply put, we continue to repeat the same old myths and legends about psychology that are not based in factual history (except the cocaine and Freud thing, that’s true). These factually inaccurate histories are embedded in how we teach “fundamental historical studies” (e.g., studies which are hailed as classics but are, in fact, complete fraud – such as the Standford Prison study) and how we talk about major theorists. Paul Meehl, an ardent proponent of Popper’s falsifiability approach to clinical science, was a Freudian despite a lack of evidence, and he found no issue in this, seeming at first glance, incongruence. He explained it noting that a lack of evidence does not indicate our inability in the future to find evidence, as told by Grant Dahlstrom with whom he was a close personal friend (Dahlstrom, 1991). Frued, as another instance, wasn’t cold or stand offish the way analytic methods are described, rather he invited clients on extended family vacations. There was no real data supporting most of the social psychology theories (e.g., Milgram, Zimbardo, etc.). Repeating again and again across topic, anything which is not based on biological processes (don’t get excited, see below) that you learned in undergraduate is about 50% false. This isn’t even the first time you’ve heard that, and I’m not the only one who’s said something like that to you.

Fact #3. Even biological processes are not understood, and we are still discovering organs.

The recent serotonin crisis in which major studies began to reveal that the leading treatment for depression doesn’t relate to depression at all. Research Domain Criteria (RDoC), the leading paradigm for linking behavior to biology via billions of dollars in federal funding, failed to produce meaning evidence of anything. We don’t know why we have some basic organs and have recently found new organs even (you can debate if the recent addition qualifies as an organ or not, but fact remains it is by technicality). We understand some things and can account for its prediction in a clear and precise pattern, akin to the logarithmic unit associated with “decibans” of a Turing Scale (e.g., smallest dose-response ratio needed to produce a given change in weight of evidence against an outcome). The “Turing Test” used as an analogous test of AI achievement (when is a computer sentient), requires the same conceptual approach. Rather than this empirical approach, we use associative conclusions which preclude causal implications (i.e., this is why we didn’t know serotonin has nothing to do with depression despite the money, lives, time, and resources spent studying it until now).

Treatment Science

Fact #1. We know basically one thing that underlies our entire theory of susceptibility: we regress under stress.

It can be assumed that each personality type has idiosyncratic susceptibilities to particular stressors and when the dynamic system of such a type is under stress, it will manifest features of psychopathology characteristic of that type.” – Grant Dahlstrom

Thus, all theories related to first factor problems in assessment, stress response, etc. stem from the basic principle that “Under stress, we regress based on our identity. A central first problem must be understanding (1) prediction of who regresses the most (i.e., sees the largest stress response), a question of latent class probability, and (2) the specific factors which are likely to occur in tandem with such regressions (e.g., pre, peri and post risk and resiliency factors). These factors are likely numerous in name but limited in conceptualization.

Fact #2. There is zero evidence of a single causal factor of psychotherapy change.

I spent 13 years at NIMH really pushing on the neuroscience and genetics of mental disorders, and when I look back on that I realize that while I think I succeeded at getting lots of really cool papers published by cool scientists at fairly large costs—I think $20 billion—I don’t think we moved the needle in reducing suicide, reducing hospitalizations, improving recovery for the tens of millions of people who have mental illness.”

– Tom Insel, Director of the National Institute of Health from 2002 until 2015.

Across all psychotherapy research, we have failed to produce novel changes in effectiveness despite decades of research and billions of dollars. Most of the studies will be efficacy stuffies, using some form of a wait list control (or active control) to contrast a treatment outcome. Effectiveness studies are less common, whereas studies of fidelity remain high. There will be no differences between most treatment component studies (e.g., dismantling studies of specific components, interventions for the same disorder across different methods). The effect sizes, regardless of metric, will measure approximately .70 to 1.25 at the conclusion of treatment. In follow-ups on the same evaluation metrics (e.g., self-report or other) will produce a smaller effect size, typically .5 to .75. Our current approach to studying change has yet to produce any evidence that we can explain any part of it. To make things even worse, we don’t even know how to describe the same phenomenon to each other effectively. As an analogy, we spend more time fighting over what story to tell the baby at bedtime (e.g., treatment myth, as per Frank and Frank’s contextual model of psychotherapy would term it) than discussing how to get the baby to sleep (e.g., better treatment outcome which is the purpose of the actual ritual of a bed time story). Likewise, psychotherapy interventions, even when conducted under 100% fidelity to the ideal treatment study for a given psychotherapy treatment in a highly specific sample (e.g., CBT for Depression in Veterans with a history of traumatic brain injury), can be explained fully by any other theory without exception. I should note that most therapist identify with distinct core tenants of around 4 to 5 distinct therapies, meaning 100% fidelity is a really interesting concept anyway. But that’s an aside. The real point is that there is no causal relationship between any claims made about psychotherapy and the outcomes, despite postulation around distinct vocabulary despite their shared functional definition.

Fact #3. Our research methods with psychotherapy are sloppy at best, and irresponsible at worst.

Exclusion of known covariates (e.g., working alliance) is a major difficulty, as is the limited outcome criteria, their widely known flawed psychometrics which do not meet evidence-based standards, and attempts to assert inappropriate comparisons to control capacity within other RCT research. Most continue to use mere T-tests, not accounting for any of the complexity which exists in all forms of complex social interactions – of which therapy is one. If change is a complex phenomenon which we do not understand (see above), then we should feel pretty guilty about continuing to use what we know are limited methods at great cost to the public and our clients, assuming equal effort elsewhere might produce some evidence of actual, empirically supported (and not emotionally entrenched to) treatment factors.

Fact #4. We are wholly unable to predict the outcome a single client in psychotherapy.

We can tell you what will likely happen if there are a large number of you (see #2), but we do not know what will happen to you in treatment. We can’t predict if you will stay in, be “successful”, or anything else. We know some standard risk factors consistent with any type of matching phenomenon research (ie., “Birds of feather” in terms of style and expectation, and visual appearance produce higher engagement but equal results).

Fact #5. Therapy outcomes are the same across all therapists.

Some studies find small effect differences across years of experience (positively associated with outcomes), but consistent research finds no difference in orientation, training, degree type, or license in terms of therapy success, regardless of the definition of success (completion, change, engagement, etc.). The implication is that we have no evidence-based standards by which we can assess or improve competency as a function of training, due (likely in part) to our lack of commitment to clarity on the state of research on what is a causal mechanism for therapy is, and what it is not.

Fact #6. Change in psychotherapy is not dose responsive or standardized.

While a large number of studies focused on the efficacy of one approach, cognitive-behavioral therapy (CBT), fewer studies have examined other widely utilized treatments including psychodynamic therapy, interpersonal psychotherapy, behavioral activation, problem-solving therapy, and emotion-focused therapy, among others. Most of these treatments have demonstrated preliminary efficacy necessitating the need for further study. In addition, while the largest body of literature is for CBT, the definition of CBT is not the same across all CBT studies. This heterogeneity limits the ability to make conclusions about the CBT model (p.53)…There is still lack of sufficient evidence on the enduring long-term effects of treatments for depression (p.54).”

– American Psychological Association’s Guidelines for the Treatment of Depression

Said another way, as approved by the American Psychological Association’s Council of Representatives, elected by its members:

Overall, treatments for depression have a modest impact on alleviating symptoms of depression (with numbers-needed-to treat of about six to eight [meaning about six to eight need to be treated for each one that is successfully treated]). This reflects both the high rate of spontaneous recovery, placebo effects of treatment, and the modest effect of treatment (either psychotherapy or pharmacotherapy). It should also be noted that there is an important group of patients who do not recover, neither through spontaneous recovery nor treatments

            -2019 APA CLINICAL PRACTICE GUIDELINE for the Treatment of Depression Across Three Age Cohorts published by the GUIDELINE DEVELOPMENT PANEL FOR THE TREATMENT OF DEPRESSIVE DISORDERS

Yup. We can’t predict effects of treatment, some people it doesn’t work for at all, and low success rates (see number to treat), and we aren’t even sure what CBT “is”, much less the issue that the same “CBT” mechanisms can’t even be sure to be “CBT” (see earlier treatment fact #2).

Fact #7. We don’t know why any medications work.

There is no evidence that the supposed mechanisms (e.g., serotonin reuptake interruption) lead to the purported outcomes (e.g., less depressed), or that we are able to predict how an individual will respond to a given type of medication. Again, we cannot actually predict our intended goals (e.g., specific patient outcomes) any better than we could a hundred years ago.

Assessment Facts

Fact #1. We have not improved measurement of invalid responding notably in quiet some time.

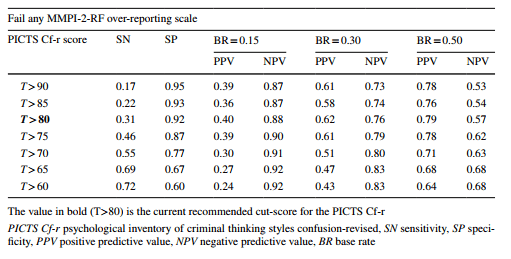
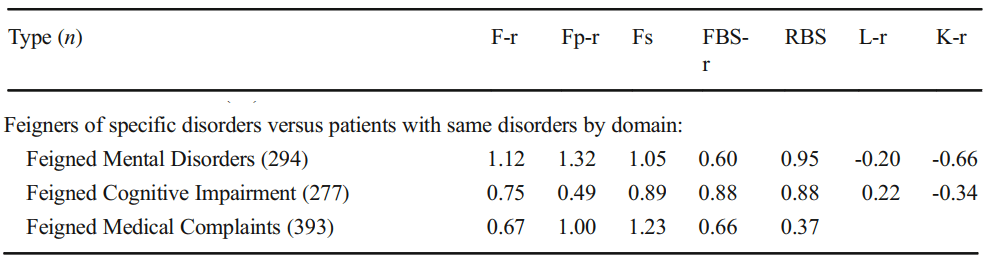
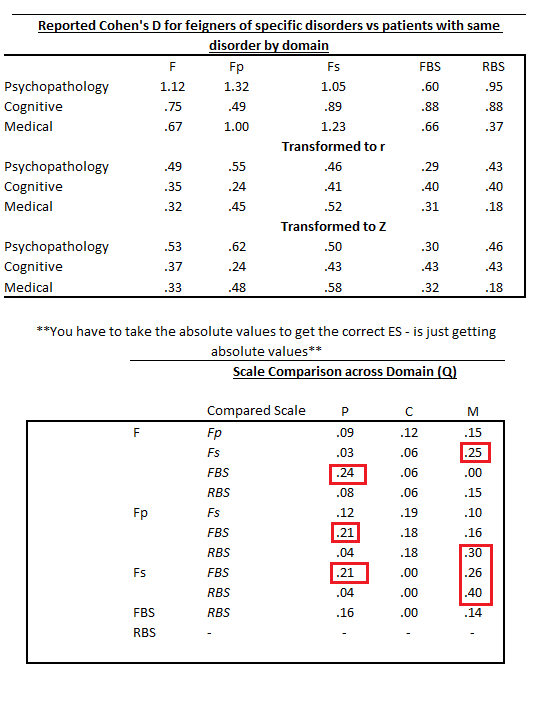
Scales tend to produce the same level of effect, depending on item scaling and contextual factors related to response style (E.g., disability evaluation, etc.), regardless of their theoretical basis or construction design. These effect sizes range from approximately .75 to 1.50. We can rule out folks with high probability by setting our scales that way, but we are poor at the detection of feigned symptoms which do not fall on normal distributions (e.g., memory or chance). Some have suggested an approximate .30 sensitivity “limit” even, terming it the “Larabee Limit”. We can reach these thresholds easily, regardless of method. We can sum scales (randomly selected, or theoretically derived), based items on theory and empirical support, or use infrequent-based approaches – they all produce the same outcomes. We can reduce or lengthen the scales, they all produce around the same effects. There aren’t major differences between theoretical taxonomical groups (See Fact #2), so we just get a lot of different tests that tell us different versions of the same thing. Once we are able to get past none of the scales mattering in what they measure or how they measure it, we can face the fact we do not know any causal reasons for elevation and can, most accurately, describe the data as being interpretable or not. We can describe certain other probabilities (e.g., malingering), but we cannot conclusively prove an internal state (motivation) in another. This issue revolves around the same issue in the treatment sciences in which causal factors are not known. Moreover, even given these limitations and ignoring them entirely, our study designs to validate these scales rarely consider any of their long-established moderators (e.g., sex, gender, ethnicity, etc. etc.). We have no real evidence of why, or how, people approach feigning across these tests, and have prioritized proposing theory rather than supporting it. Our approaches remain relatively unchanged for decades, with only the smallest adaptions being infused (e.g., incorporating an empirical keying-style approach to validity scale detection, in addition to clinical scales [RBS on MMPI and CBS on PAI], using infrequent approaches on a specific population with higher pathology to adjust the base rate of infrequency [Fp, Fs, etc.]). These changes, as noted previously, have not produced sizable or notable change in effects across decades of meta-analyses.

Fact #2. Even our most advanced diagnostic models are not truly taxonomical.

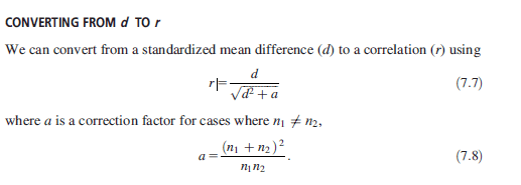
Linnaean delineation of species (e.g., classifications that determine if a bat is a mammal or a fishy) does not match our current approaches because we use covariance based assumptions, rather than appropriate modeling. Such a modeling difficulty is consistent with the mismatch between “Historical Science” and “Predictive Science” (). This terminology is from Harvard circa the early 1990s to describe different science tracks, based on different approaches to discovery. Darwin, when providing evidence of evolution, wasn’t able to manipulate time, but rather approached science from a distinct approach more fitting to the research question than the controllable predictive sciences. Perhaps psychology should adapt methods fit more for the Bayesian, probability-based model building, rather than strict empirical controls (e.g., Hi-Top, RCTs). Historical science approaches using “uniformitarian assumptions” and “history inference” are successful at producing predictable outcomes, but we do not use these methods in psychology effectively. Said more clearly within modern models of treatment research, perhaps idiographic meta-analysis will provide the strongest basis of truth upon which to expand into larger predictive models (erosion and plate tectonic deductions also worked like this as their current predictive models were developed).

Anyway, back to Netflix. Wheel of time needs to hurry up.

Some Comparisons of Validity Scales Across Somatic, Psychological, and Cognitive Symptoms

Feigning is frequently conceptualized across somatic, psychological, and cognitive symptom sets (e.g., Slick et al., 1999; Sherman et al., 2020), in both SVTs and PVTs (see Rogers & Bender, 2018 for a more comprehensive summary). Given this conceptual mapping of response set targets, validity scales have been developed for the popular personality (e.g., MMPI, PAI) self report measures to target feigning/symptom exaggeration/over-reporting (or whatever term you prefer). For instance, Cognitive symptoms are assessed on the MMPI-2/RF/3 best with the Response Bias Scale (RBS; Gervais et al., 2007) which used PVT-based criterion coded items identified for a bootstrapped blended SVT-PVT (Burchett & Bagby, 2021). Mirroring RBS, the Cognitive Bias Scale (CBS) was developed for the PAI and has been widely cross validated, including by the PATs lab. Similarly, the MMPI contains measures for somatic/medical concerns (Fs) and scales designed explicitly for psychopathology (F, Fp). While a full review of the various scales across measures, and their measurement approaches, is beyond this brief blog entry, it is important to note that these scales are conceptually accepted as measuring their intended domains of symptoms.

Below is a copy of part a table in Sharf et al. (2017), in which Dr. Rogers (an international and leading expert of feigning and its detection) codes MMPI-2-RF feigning research across the three domains (see Table 3 in the article). They then calculate overall meta-analytic estimates (Table 5) for each scale, overall (any feigner) as well as by specific subsections of feigners (e.g., the three symptom sets). I want to provide this first and allow a moment to review so that you can become familiar with the research approach to incorporating this theory into testable models (note, table is partially presented to stay focused).

If you compare F’s effectiveness across Medical, Cognitive, and Medical, it’s clear that the effect size is largest in one domain (Psych, 1.12) over the others (.75 and .67). There isn’t a statistical test to evaluate the difference (Fischer r to z/Cohen’s Q), but it eyeballs to look fine (quick reminder of why Cohen’s Q works due to d:r equality below).

HOWEVER, this does not indicate that F is best at detecting psychopathology. It indicates the scale works better in those populations. This is not comparative to the other scales (Fp, FBS, RBS, etc.). To determine if F > Fp, we need to evaluate their effectiveness across the rows of the table. F and Fp should be better than other scales (Fs, FBS, RBS) in medical. FBS and RBS should be better in cognitive settings. Medical should be best for Fs. That’s how the theory maps on.

When I use the word “better”, I mean a moderate effect size difference (e.g., d/g >= .5). This is the standard guidance for a ‘significant’ difference of clinical impact (see Cohen, 1988; Rosnow et al., 2000) and is the common metric for personality assessment research on criterion effectiveness. I’ve re-created the data above after computing Cohen’s Q statistics. Cohen’s Q works because of the equality of r/z/d/etc and allows a procedure useful in comparing effects across groups. Recent work in personality assessment has started to use Cohen’s Q to evaluate these differences (e.g., Morris et al., 2023), including beyond work being done within the PATS lab. Some quick transformations in the top table, and Q values in the one below.

Those patterns don’t look to support the whole three domain focus on feigning. In fact, it aligns more with recent work on general feigning approaches (Gaines et al., 2013; Keen et al., 2022) that highlight the lack of sophistication in symptom experience misrepresentation (see Morris et al., 2021 for an evaluation of effects across feigning conditions).

! ! Warning, rambling alert incoming ! !

I don’t know if these numbers means the theory doesn’t hold up, or that we don’t have scales to test it. Given the general similarity in scale effectiveness (meta-analytically and across individual studies) and a general lack of improvement in metric or method in SVTs during the last 20 years, I tend to doubt we have refined enough scales to really test the theory. Response method (self-report) may account for a sufficient portion of the latent construct of ‘motivation and approaches to feigning’. One option may be blending various response scales, using IRT to identify variations in item information that may be informative, testing of timing and screen behaviors, or other alternative testing techniques. It may also be useful to go back and ask people. We have often found as a field that asking people is easier than more complicated methods, and yields better prediction. I’m not sure if the Cohen Q effect differences should be used with standard guidance for interpretation of score range. Those are certainly flawed and far from actually standard anyway. Effects in the feigning research (esp. simulation) tend to be larger than the metrics frequently used in other contrasts (.3, .5, .8). Still, perhaps the variation is smaller than we anticipate. That alone is worth consideration.

Former NIH Director Tom Insel is famed for having said “I spent 13 years at NIMH really pushing on the neuroscience and genetics of mental disorders, and when I look back on that I realize that while I think I succeeded at getting lots of really cool papers published by cool scientists at fairly large costs—I think $20 billion—I don’t think we moved the needle in reducing suicide reducing hospitalizations, improving recovery for the tens of millions of people who have mental illness.”

Just some thoughts I’ve had the last few weeks. I’d be curious to hear thoughts you may have. Maybe I’m barking up the wrong tree entirely with these ramblings.

~Paul, 7.15.23

MMPI-3 Eating Concerns (EAT) Scale In college Men and Women

Cole’s recent paper examining the new EAT scale in the MMPI-3! In addition to expanding available correlations / validity coefficients (see table below), the paper examines differences in relationships between EAT scores and those criterions based on gender. Before diving into the findings, its important to note that prior research has found EAT to be related to binge and purge behaviors, but other forms of disordered eating to be underassessed. Findings of our paper indicate that not only do differences emerge on binging and purging behaviors (typically stronger for women than for men), but that there are differences in endorsement rate and elevation frequency. Differences in endorsement and elevation frequency may reflect prevalence differences existing between men and women as a function of symptom prevalence; however, differential validity coefficients have interpretive implications for use of EAT. Further work investigating differential validity as a function of diversity characteristics is warranted, as those characteristics often produce differential prevalence and presentation patterns of disordered eating.

Download the article PDF Here.

Lab news

In our lab group text this morning, it was confirmed that this picture of Brittney should be a very important lab website update. I did it quickly enough that I only received minimal harassment for not focusing on what matters quickly enough. However, I wont publicly name the person who shamed me into hurrying up on posting it, as I’m definitely more mature than to name them publicly.

On an entirely related note, Keegan is kicked out of the lab again. Sarah also proposed that he be kicked out a second, simultaneous time for thinking he might not have be kicked out. We’re holding a lab vote now to determine if he should be kicked out, perhaps a third time today (vote below). I am yet to confirm which way Keegan voted.

The MMPI-3’s Eating Concerns (EAT) Scale: A study on

The PATS lab just published another paper on the MMPI-3, just accepted into the Journal of Personality Assessment. This time, we took a look at the new 5-item Eating Concerns (EAT) scale and examined the potential of gender differences on its utility and validity. Because EAT is designed as a general screener of eating pathology, and because past work has found an over-focus on restrictive and purging disordered eating patterns, we expected that gender-related trends in eating behaviors would translate into different validity and general utility.

In short, we were right. We found, consistent with past research, that eating patterns more associated with masculinity and seen more frequently in men (e.g., binge eating, bulking, etc) were less evident on EAT. Men were less likely to endorse items, achieve clinically significant elevations, and demonstrated weaker validity coefficients to external criteria relative to women. Validity coefficient differences varied depending on the criteria/content area, ranging from small to large. Differences generally fell just below a medium effect, so while this may not mean clinically impactful differences to some (see Rosnow et al., 2000) it does increase the consistent probability of error during interpretation because the trends are so widespread.

These patterns were replicated not only in our sample of college students, but also within the technical manual’s comparison samples (Normative, outpatient, private practice, and college student) which provides strong evidence of generalizability. Broadly, our work emphasizes the need to incorporate a more diverse and multiculturally sensitive approach to scale creation in issues with well known differential presentation patterns. Specific to disordered eating, our research draws into questions how gender is evaluated in scale differential functioning. Specifically, we postulate a need for studies on trans/non-binary individuals, as well as gender norms’ impact on scale interpretation more broadly. Cole’s ongoing work on these two points will offer clinicians guidance about how to make sure no issues are missed, or over-interpreted, across different groups.

Some important things to note: (1) This is YET ANOTHER paper by the fantastic Cole Morris and (2) The second author is one of our former undergrad RAs who is now off doing their masters program at NorthWestern. Citation below. pre-print PDF coming soon.

Morris, N.M., Shepard, E., & Ingram, P.B. (In Press) Investigating the Validity of the MMPI-3 Eating Concerns (EAT) scale in a University Sample: Replication and Extension. Journal of Personality Assessment

Cole Morris is a Rockstar!

Tam is likely the unsung hero of this paper and all of Cole’s successes. I have no citations for that fact, but look at that sweet kitty face.

Lets just take a second to dote on them and highlight the reasons (something I’m sure is making them cringe as they read this): (1) they have A-FREAKING-TON of publications as a grad student, (2) people see them as independent and their research thinking is 1000% on point for a starting faculty (even though they are a few years away), and (3) they….. WON THE 2023 MARY S. CERNEY STUDENT PAPER AWARD FROM THE SOCIETY OF PERSONALITY ASSESSMENT.

Yup, thats right. Cole’s working conducted using three conditions of simulated respondents on MMPI-3 over-reporting scales (mTBI, PTSD, co-morbid) was recognized as making an impact on the field. I’ve always been a huge fan of that paper (click me to read it), but clearly everyone else is as well. Great work Cole.

Society of Personality Assessment: Conference Planning!

Well, March is going to be exciting! PATS is headed to SPA again and the amazing Tina Greene put together an awesome program guide to help those who are at SPA who want to see what our lab is doing – and for the PATS lab to keep track of all 14(!!) different presentations/awards. Click here to download the PDF guide to the program. Below is a one page summary of the research title/date-time/and lead author.

New Article: mTBI response patterns in Active-Duty personnel on the PAI

Previous work has examined PAI response patterns on those with mild traumatic brain injury (mTBI), but these research efforts have faced a number of notable challenges. Accordingly, findings between studies have often contradicted. There are a variety of reasons for these contradictions including, but not limited to, that prior research has: (1) not excluded individuals from analysis with failed validity testing, meaning that data analyzed is likely not fully valid/reliable, (2) the inappropriate use of item-level grouping analyses (factor analysis) to identify groups of participants, which is better suited to cluster/profile analysis, (3) insufficient sample sizes to conduct any of the analyses undertaken (i.e., far fewer participants per observed variable analyzed than required; see Brown, 2015), (4) interpretation of scale means that are entirely normative (i.e., T-score mean of 50, corresponding to the normative sample’s mean) as indicating a clinical pattern, and (5) use of analyses without fit statistics, making comparison between identified cluster solutions tentative at best. We aimed to address these limitations through our study, now in press at Archives in Clinical Neuropsychology. CLICK ME TO DOWNLOAD A PREPRINT.

Taking these challenges into account, as well as the unique need to focus on military populations who face higher head injury rates than others, our recent paper used latent profile analysis (LPA) to explore potential groups of mTBI diagnosed respondents on the Personality Assessment Inventory (PAI). Although prior and related mTBI work (see above) had identified a variety of cluster solutions (2-4 classes), we hypothesized that we would not find meaningful classes. Rather, class extraction would represent a continuous underlying pattern of symptom severity – not functionally distinct groups. We grounded this finding in some prior work we conducted on PTSD groups in the PAI (see Ingram et al., 2022; Click for PDF) as well as the first- factor problem of the PAI.

I pulled a few sentences that I think sum up everything particularly well from the discussion below to summarize these results.

The findings here have a few distinct implications: (1) prior group identification efforts are not replicated in AD personnel and may, instead, represent broader issues with analysis discussed above rather than meaningful findings, (2) the first factor problem (general elevation of substantive clinical scales due to distress, not specific pathology) may also play a role in the observed patterns and should be addressed to aid in the future of the PAI (see Morey, 1996 for discussion of the first factor problem).

As an aside, Tristan (post-bac RA) was the second author on this paper and absolutely killed it with his work on the paper. Not only did he handle about half of the analyses (everything not doing latent clustering), he also learned about how these cluster method work so that he could write some of the discussion and handled 95% of all edits needed for the revise and resubmit. Really awesome work and hats off to him!

Cognitive Over-Reporting Detection on the Personality Assessment Inventory (PAI)

Click here to download the article PDF

We had another paper published recently looking at the detection of cognitive over-reporting on the PAI, examining the CBS again (see also Armistead-Jehle et al., 2021) along with the new CB-SOS scales. The SOS scales offer a scale level approach to incorporating a cognitive-specific over-reporting scale, rather than needing items like CBS. This paper is in press in the The Journal of Military Psychology with Tristan Herring (lab post-bac), Cole Morris (advanced doctoral student), and the amazing Dr. Pat Armistead-Jehle.

Medium effects were observed between those passing and failing PVTs across all scales. The CB-SOS scales have high specificity (≥.90) but low sensitivity across suggested cut scores. While all CB-SOS were able to achieve .90, lower scores were typically needed. CBS demonstrated incremental validity beyond CB-SOS-1 and CB-SOS-3; only CB-SOS-2 was incremental beyond CBS. In a military sample, the CB-SOS scales have more limited sensitivity than in its original validation, indicating an area of limited utility despite easier calculation. The CBS performs comparably, if not better, than CB-SOS scales. CB-SOS-2’s differences in performance in this study and its initial validation suggest that its psychometric properties may be sample dependent. Given their ease of calculation and relatively high specificity, our study supports the interpretation of elevated CB-SOS scores indicate those who are likely to fail concurrent PVTs. Specific results are provided below.

These findings are commensurate with the initial CB-SOS validation study (Boress et al., 2021) and to the recent study on CB-SOS with Veterans (Shura et al., in press). However, results are also distinct as they highlight the need for different cut scores to meet the comparable classification rates. Within active-duty personnel, CB-SOS and CBS perform in a largely similar manner (e.g., comparable sensitivity, specificity, positive and negative predictive power); however, CBS has a small amount of incremental, predictive utility suggesting that it may be the front-line scale. However, calculation of the CBS requires access to PAI item responses and is somewhat more cumbersome to acquire. When those are not available, the CB-SOS scales seem to represent good alternatives to assess cognitive symptom over-reporting.

More Military Neuro Work: Examining the Memory Complaints Inventory (MCI)

This was another awesome project to do with the fantastic Dr. Pat Armistead-Jehle. One of the major shortcomings of the Green’s MCI is its lack of of work with other SVTs, despite the limited work to date cross validating the MCI with those measures (Armistead-Jehle & Shura, 2022). This study was intended to expanded that limited research, using the recently validated CBS scale from the PAI as the criterion (related, to see Shura et al, 2022 which I recently helped published). You can download a pdf copy of the article HERE.

Short version of findings from this new work is that the MCI has good evidence of classification accuracy using recommended cut-scores. We only used one SVT criterion and similar measures on other broadband measures (e.g., MMPI-3’s RBS scale) are needed to further this line of work. Below are the classification and effect metrics across each of the MCI scales.