Feigning is frequently conceptualized across somatic, psychological, and cognitive symptom sets (e.g., Slick et al., 1999; Sherman et al., 2020), in both SVTs and PVTs (see Rogers & Bender, 2018 for a more comprehensive summary). Given this conceptual mapping of response set targets, validity scales have been developed for the popular personality (e.g., MMPI, PAI) self report measures to target feigning/symptom exaggeration/over-reporting (or whatever term you prefer). For instance, Cognitive symptoms are assessed on the MMPI-2/RF/3 best with the Response Bias Scale (RBS; Gervais et al., 2007) which used PVT-based criterion coded items identified for a bootstrapped blended SVT-PVT (Burchett & Bagby, 2021). Mirroring RBS, the Cognitive Bias Scale (CBS) was developed for the PAI and has been widely cross validated, including by the PATs lab. Similarly, the MMPI contains measures for somatic/medical concerns (Fs) and scales designed explicitly for psychopathology (F, Fp). While a full review of the various scales across measures, and their measurement approaches, is beyond this brief blog entry, it is important to note that these scales are conceptually accepted as measuring their intended domains of symptoms.
Below is a copy of part a table in Sharf et al. (2017), in which Dr. Rogers (an international and leading expert of feigning and its detection) codes MMPI-2-RF feigning research across the three domains (see Table 3 in the article). They then calculate overall meta-analytic estimates (Table 5) for each scale, overall (any feigner) as well as by specific subsections of feigners (e.g., the three symptom sets). I want to provide this first and allow a moment to review so that you can become familiar with the research approach to incorporating this theory into testable models (note, table is partially presented to stay focused).
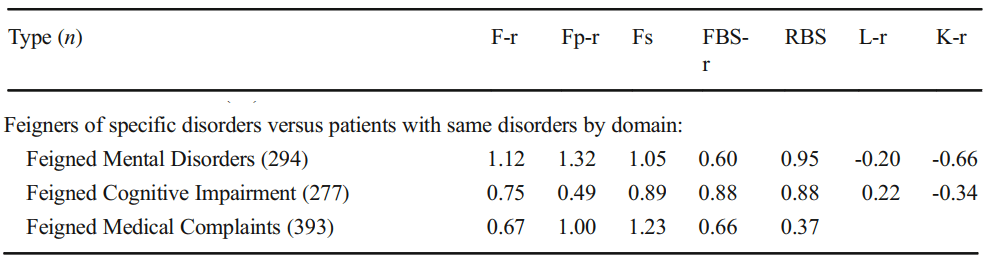
If you compare F’s effectiveness across Medical, Cognitive, and Medical, it’s clear that the effect size is largest in one domain (Psych, 1.12) over the others (.75 and .67). There isn’t a statistical test to evaluate the difference (Fischer r to z/Cohen’s Q), but it eyeballs to look fine (quick reminder of why Cohen’s Q works due to d:r equality below).
HOWEVER, this does not indicate that F is best at detecting psychopathology. It indicates the scale works better in those populations. This is not comparative to the other scales (Fp, FBS, RBS, etc.). To determine if F > Fp, we need to evaluate their effectiveness across the rows of the table. F and Fp should be better than other scales (Fs, FBS, RBS) in medical. FBS and RBS should be better in cognitive settings. Medical should be best for Fs. That’s how the theory maps on.
When I use the word “better”, I mean a moderate effect size difference (e.g., d/g >= .5). This is the standard guidance for a ‘significant’ difference of clinical impact (see Cohen, 1988; Rosnow et al., 2000) and is the common metric for personality assessment research on criterion effectiveness. I’ve re-created the data above after computing Cohen’s Q statistics. Cohen’s Q works because of the equality of r/z/d/etc and allows a procedure useful in comparing effects across groups. Recent work in personality assessment has started to use Cohen’s Q to evaluate these differences (e.g., Morris et al., 2023), including beyond work being done within the PATS lab. Some quick transformations in the top table, and Q values in the one below.
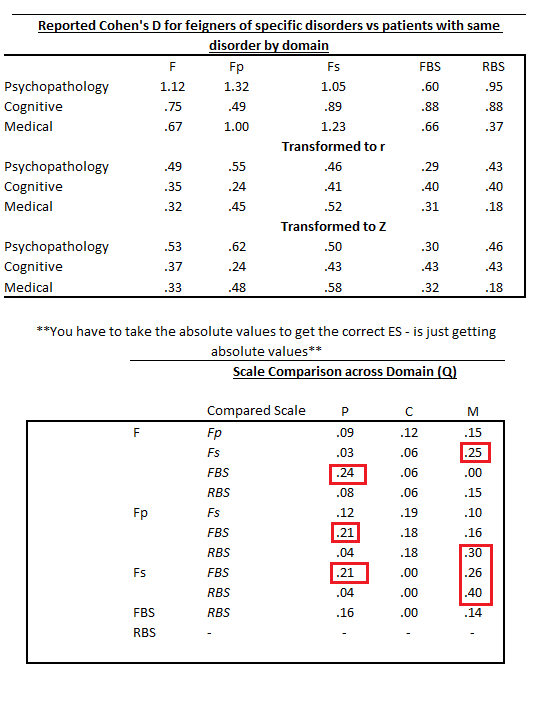
Those patterns don’t look to support the whole three domain focus on feigning. In fact, it aligns more with recent work on general feigning approaches (Gaines et al., 2013; Keen et al., 2022) that highlight the lack of sophistication in symptom experience misrepresentation (see Morris et al., 2021 for an evaluation of effects across feigning conditions).
! ! Warning, rambling alert incoming ! !
I don’t know if these numbers means the theory doesn’t hold up, or that we don’t have scales to test it. Given the general similarity in scale effectiveness (meta-analytically and across individual studies) and a general lack of improvement in metric or method in SVTs during the last 20 years, I tend to doubt we have refined enough scales to really test the theory. Response method (self-report) may account for a sufficient portion of the latent construct of ‘motivation and approaches to feigning’. One option may be blending various response scales, using IRT to identify variations in item information that may be informative, testing of timing and screen behaviors, or other alternative testing techniques. It may also be useful to go back and ask people. We have often found as a field that asking people is easier than more complicated methods, and yields better prediction. I’m not sure if the Cohen Q effect differences should be used with standard guidance for interpretation of score range. Those are certainly flawed and far from actually standard anyway. Effects in the feigning research (esp. simulation) tend to be larger than the metrics frequently used in other contrasts (.3, .5, .8). Still, perhaps the variation is smaller than we anticipate. That alone is worth consideration.
Former NIH Director Tom Insel is famed for having said “I spent 13 years at NIMH really pushing on the neuroscience and genetics of mental disorders, and when I look back on that I realize that while I think I succeeded at getting lots of really cool papers published by cool scientists at fairly large costs—I think $20 billion—I don’t think we moved the needle in reducing suicide reducing hospitalizations, improving recovery for the tens of millions of people who have mental illness.”
Just some thoughts I’ve had the last few weeks. I’d be curious to hear thoughts you may have. Maybe I’m barking up the wrong tree entirely with these ramblings.
~Paul, 7.15.23
